
Southern Indiana's Fastest-Growing Towns: Utica Up 48%, and Where New Homes Are Adding Up
Census counts for 2020 to 2025 show which Southern Indiana towns grew fastest, from Utica's 47.8% to Jeffersonville's 4,680 new residents, plus permits.
- Southern Indiana
- Clark County
- new construction
- buying
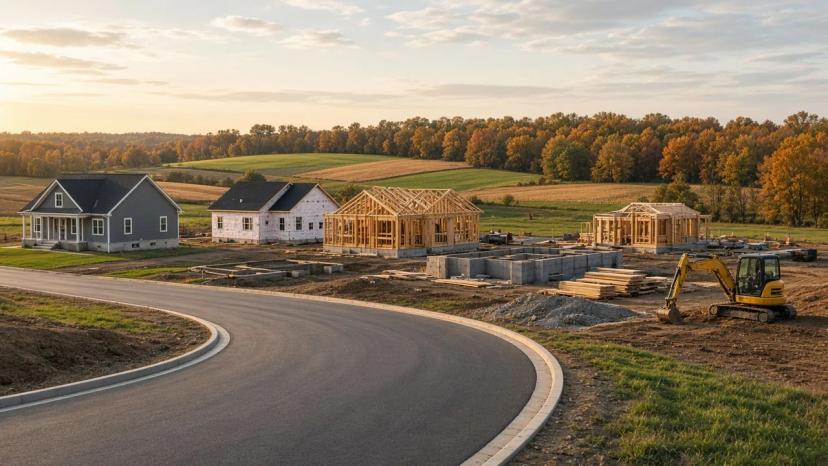
Utica grew faster than any other Southern Indiana town with at least 1,000 residents, up 47.8% from 878 people in 2020 to 1,298 in 2025. Charlestown (12.8%), Sellersburg (10.2%) and Jeffersonville (9.5%) came next, according to the Census Bureau's Vintage 2025 city and town estimates. Jeffersonville added the most people, 4,680.
This post sticks to two public counts for the five Indiana counties in our reports (Clark, Floyd, Harrison, Scott and Washington): Census population estimates and the Census Building Permits Survey. It doesn't forecast anything and it doesn't describe who moved. It is general information, not tax, legal or lending advice.
Southern Indiana growth at a glance
- Clark County added 9,341 residents from April 2020 to July 2025, up 7.7% (Census)
- 5,696 new housing units permitted in Clark County, 2021 to 2025 (Census BPS)
- Jeffersonville ranked 8th of 48 Indiana cities and towns of 20,000 or more for growth since 2020 (Census)
- New Albany, Clarksville and Salem lost residents over the same five years
Start your Match Profile, and a member of our team will review your Match Profile. Already working with someone? Get a second opinion.
Key takeaways
- Four towns grew 9% or more since 2020: Utica, Charlestown, Sellersburg and Jeffersonville, all in Clark County (Census Vintage 2025).
- Clark County did most of the adding. Its 9,341 new residents were about 74% of the five-county gain of 12,682.
- Jeffersonville permitted 2,692 housing units from 2021 to 2025, half of them single-family homes (Census BPS place files).
- A lot of the building is outside town limits. Unincorporated Clark County permitted 398 units in 2025, more than Jeffersonville's 237.
- The two biggest older cities shrank a little. New Albany fell 0.9% and Clarksville 0.5% from 2020 to 2025.
Table of contents
- What are the fastest-growing towns in Southern Indiana?
- Where are new homes being permitted?
- How much growth is outside town limits?
- What are the fastest-growing towns in Indiana?
- What the counts can't tell you
- How to use these counts if you're buying or selling
- FAQs
What are the fastest-growing towns in Southern Indiana?
Short answer: Utica, Charlestown, Sellersburg and Jeffersonville, measured by percent change from the April 2020 Census base to July 1, 2025. The table covers every incorporated town in the five counties with at least 1,000 residents in 2025. Figures are from the Census Bureau's Vintage 2025 estimates, released May 14, 2026.
| Town | County | April 2020 | July 2025 | Change since 2020 | Percent | Change, 2024 to 2025 |
|---|---|---|---|---|---|---|
| Utica | Clark | 878 | 1,298 | +420 | +47.8% | +39 |
| Charlestown | Clark | 7,802 | 8,802 | +1,000 | +12.8% | +209 |
| Sellersburg | Clark | 9,347 | 10,305 | +958 | +10.2% | +208 |
| Jeffersonville | Clark | 49,454 | 54,134 | +4,680 | +9.5% | +1,107 |
| Greenville | Floyd | 1,368 | 1,452 | +84 | +6.1% | -6 |
| Austin | Scott | 4,057 | 4,254 | +197 | +4.9% | +68 |
| Scottsburg | Scott | 7,354 | 7,478 | +124 | +1.7% | +37 |
| New Pekin | Washington | 1,360 | 1,378 | +18 | +1.3% | +3 |
| Georgetown | Floyd | 3,821 | 3,855 | +34 | +0.9% | +11 |
| Corydon | Harrison | 3,174 | 3,196 | +22 | +0.7% | +12 |
| Clarksville | Clark | 22,358 | 22,253 | -105 | -0.5% | +184 |
| New Albany | Floyd | 37,810 | 37,463 | -347 | -0.9% | -105 |
| Salem | Washington | 6,524 | 6,427 | -97 | -1.5% | -16 |
Source: U.S. Census Bureau, Vintage 2025 subcounty population estimates (April 1, 2020 estimates base and July 1 estimates). Percentages are Agent Intro calculations from those counts.
Utica's percentage is big because its starting point was small. It added 420 people. Jeffersonville added more than 11 times that. Read the percent column and the count column together.
How did the counties compare?
| County | April 2020 | July 2025 | Change | Percent |
|---|---|---|---|---|
| Clark | 121,110 | 130,451 | +9,341 | +7.7% |
| Floyd | 80,481 | 82,153 | +1,672 | +2.1% |
| Harrison | 39,656 | 40,437 | +781 | +2.0% |
| Scott | 24,387 | 25,053 | +666 | +2.7% |
| Washington | 28,161 | 28,383 | +222 | +0.8% |
| Indiana | 6,786,605 | 6,973,333 | +186,728 | +2.8% |
Source: Census Vintage 2025 estimates for Indiana. Clark County grew at nearly three times the statewide rate. Across the river, Jefferson County, Kentucky, grew 1.6% over the same period, from 782,962 to 795,222 (Census Vintage 2025 estimates for Kentucky).
For home prices in each county, see our Southern Indiana county comparison for Q3 2026. This post doesn't repeat those numbers.
Where are new homes being permitted?
Short answer: Jeffersonville and unincorporated Clark County. Together they permitted 4,298 new housing units from 2021 to 2025, according to the Census Building Permits Survey. A permit counts a unit authorized to be built, not a home finished or sold.
| Permit office | Units permitted, 2021 to 2025 | Single-family units | Units permitted, 2025 |
|---|---|---|---|
| Jeffersonville | 2,692 | 1,346 | 237 |
| Clark County (unincorporated) | 1,606 | 1,558 | 398 |
| Floyd County (unincorporated) | 1,136 | 840 | 325 |
| Harrison County (listed countywide by Census) | 811 | 727 | 159 |
| Charlestown* | 456 | 431 | 73 |
| Sellersburg | 436 | 88 | 26 |
| Clarksville | 369 | 81 | 34 |
| New Albany* | 232 | 232 | 46 |
| Washington County (unincorporated) | 170 | 166 | 34 |
| Utica | 137 | 103 | 26 |
| Austin | 135 | 135 | 38 |
Source: Census Building Permits Survey annual place files for 2021, 2022, 2023, 2024 and 2025. Totals include imputed units. *Charlestown reported no months in 2024 or 2025 and one month in 2023, and New Albany reported no months in any year shown, so most of their figures are Census estimates, not permit counts from the city.
Sellersburg grew by 958 residents but permitted only 88 single-family units in town limits. Most of its 436 units were in buildings with two or more units, 252 of them in 2021 alone. Clarksville is similar. It permitted 284 units in 2022, and only 14 of those were single-family.
County permit totals
| County | Units permitted, 2021 to 2025 | Single-family units | Units permitted, 2025 |
|---|---|---|---|
| Clark | 5,696 | 3,607 | 794 |
| Floyd | 1,403 | 1,103 | 376 |
| Harrison | 811 | 727 | 159 |
| Scott | 295 | 295 | 38 |
| Washington | 171 | 167 | 34 |
Source: Census Building Permits Survey annual county files for 2021, 2022, 2023, 2024 and 2025.
Clark County accounted for 68% of the 8,376 units permitted across the five counties. Permits there kept coming in 2026. Preliminary Census counts show 674 units permitted in Clark County from January to September 2026 (BPS, September 2026 year to date), up from 623 in the same months of 2025 (BPS, September 2025 year to date).
How much growth is outside town limits?
Short answer: a lot of it. Unincorporated Clark County, the parts outside any city or town, gained 2,328 residents from 2020 to 2025, up 7.6%. Unincorporated Floyd County, which includes Floyds Knobs, gained 1,901, up 5.1% (Census Vintage 2025).
| Unincorporated area | April 2020 | July 2025 | Change | Percent |
|---|---|---|---|---|
| Clark County | 30,489 | 32,817 | +2,328 | +7.6% |
| Floyd County | 37,482 | 39,383 | +1,901 | +5.1% |
| Harrison County | 33,709 | 34,435 | +726 | +2.2% |
| Scott County | 12,976 | 13,321 | +345 | +2.7% |
| Washington County | 19,361 | 19,637 | +276 | +1.4% |
That matters for a buyer because a new subdivision with a town name in its address may not be inside that town. The county, not the town, issues the building permits there, as the Census permit files show. Check the parcel on the county's property records before you assume which property tax district a home is in. Floyds Knobs numbers are in our Floyds Knobs September 2026 report.
What are the fastest-growing towns in Indiana?
Short answer: Indianapolis-area suburbs lead the state, and Jeffersonville is the top Southern Indiana city on the list. Among Indiana cities and towns with 20,000 or more residents, Westfield grew fastest from 2020 to 2025, up 42.7%. St. John was second at 22.4% and Brownsburg third at 17.4% (Census cumulative change table).
| Indiana rank (20,000 or more) | City or town | Change since 2020 | Percent |
|---|---|---|---|
| 1 | Westfield | +19,814 | +42.7% |
| 2 | St. John | +4,542 | +22.4% |
| 3 | Brownsburg | +5,056 | +17.4% |
| 4 | Avon | +3,659 | +16.9% |
| 5 | Greenfield | +3,087 | +13.2% |
| 6 | Plainfield | +3,917 | +11.3% |
| 7 | Zionsville | +3,071 | +10.1% |
| 8 | Jeffersonville | +4,680 | +9.5% |
Jeffersonville ranked 8th of 48 Indiana places that size. Nationally it ranked 263rd of 1,868 cities of 20,000 or more in the same Census table. Among smaller Indiana towns, Whitestown (about 15,800 people in 2025) grew 53.4% by the same measure (Census Vintage 2025).
What the counts can't tell you
Short answer: they show how many, not why, and not what comes next. Census population estimates are estimates, not a new census. Each year the Bureau revises the whole series back to 2020, and it says to compare years only within the same vintage (Census release). This post uses Vintage 2025 for every year.
Permits have their own limits. A permitted unit can be delayed or never built. A town that doesn't report gets a Census estimate, as Charlestown and New Albany did. Permits also don't tell you price. For what homes sell for, see the town reports linked below.
Clark County is also home to River Ridge Commerce Center, a business park of about 6,000 acres (River Ridge). The River Ridge Development Authority counted 13,304 jobs on site in 2025 (RRDA, April 20, 2026), and the park passed 20 million square feet of buildings in December 2025 (RRDA, Dec. 18, 2025). The counts above don't say how many residents work there.

We didn't include local MLS sales of new construction in this post. Town-level price and listing numbers are in our September 2026 reports for Charlestown, Sellersburg, Clarksville, Scottsburg, Corydon and New Albany.
How to use these counts if you're buying or selling
Short answer: use them to know where the new inventory is, then check the house and the parcel.
- Buying new construction: most new single-family permits in these counties were in Jeffersonville and unincorporated Clark and Floyd counties. Ask the builder what is included, what the warranty covers and whether you'll have your own real estate agent. Our new construction vs. resale post has the questions.
- Comparing towns: set the population table next to prices and taxes. Our Living in New Albany guide and the county reports for Clark, Floyd, Harrison, Scott and Washington counties have those numbers.
- Running a budget: try the Clark County affordability calculator or the main affordability calculator.
- Selling an older home near new subdivisions: new builds are your competition on price and features. Price against recent resales, not new-build asking prices. See Selling.
Agent Intro is an introduction and referral service for home buyers and sellers in Southern Indiana and Greater Louisville. We introduce you to one of our vetted local real estate agents, and you decide whether to hire them. Start your Match Profile, and a member of our team will review your Match Profile. Already working with someone and want a second look? Second Opinion gets you an alternative introduction to compare. See How It Works, How We Choose Agents, Buying, our Jeffersonville buyer page and our FAQ.
Disclosure: Agent Intro is an introduction and referral service of Aire Realty, LLC, an Indiana-licensed real estate brokerage. Agent Intro earns a referral fee when an introduction leads to a closed transaction. You're not required to hire anyone. See our Disclosure. This post is general information, not tax, legal or lending advice.
FAQs
What is the fastest-growing town in Southern Indiana?
By percent, Utica in Clark County, up 47.8% from 878 residents in April 2020 to 1,298 in July 2025 (Census Vintage 2025). By number of people added, Jeffersonville, up 4,680 to 54,134.
What are the fastest-growing towns in Indiana?
Among Indiana cities and towns of 20,000 or more, Westfield grew fastest from 2020 to 2025 at 42.7%, followed by St. John and Brownsburg. Jeffersonville ranked 8th of 48 at 9.5% (Census).
Is Clark County, Indiana growing?
Yes. Clark County added 9,341 residents from April 2020 to July 2025, up 7.7%, compared with 2.8% for Indiana. It also permitted 5,696 new housing units from 2021 to 2025 (Census).
Where are the most new homes being built in Southern Indiana?
By permits, Jeffersonville led with 2,692 units from 2021 to 2025, followed by unincorporated Clark County with 1,606 and unincorporated Floyd County with 1,136 (Census Building Permits Survey).
Is New Albany's population growing?
Not in the Census estimates. New Albany went from 37,810 in April 2020 to 37,463 in July 2025, down 0.9%. Unincorporated Floyd County grew 5.1% over the same period.
Data note: Population figures are U.S. Census Bureau Vintage 2025 subcounty estimates (April 1, 2020 estimates base to July 1, 2025), released May 14, 2026. Permit figures are Census Building Permits Survey annual place and county files for 2021 to 2025 and preliminary year-to-date county files through September 2026, retrieved November 11, 2026. Permit totals include Census imputation for months a permit office didn't report. Percentages and shares are Agent Intro calculations from those counts.
Ready for a thoughtful introduction?
Tell us about your move. Get one carefully selected introduction. No obligation to hire.
Find my agent ↗