
Charlestown Housing Market, September 2026: Sales Steady, More Homes to Choose From
Charlestown, IN: 347 homes sold Jan to Sep 2026, the same pace as 2025, while the average month had 23% more homes for sale. What it means for you.
- buying
- selling
- market data
- Southern Indiana

Charlestown's sales are holding steady while buyers get more homes to choose from. From January to September 2026, 347 homes sold, compared with 346 in the same months of 2025. The average month had 151 homes for sale, up 23%. September had 172 listings and 36 sales.
Key takeaways
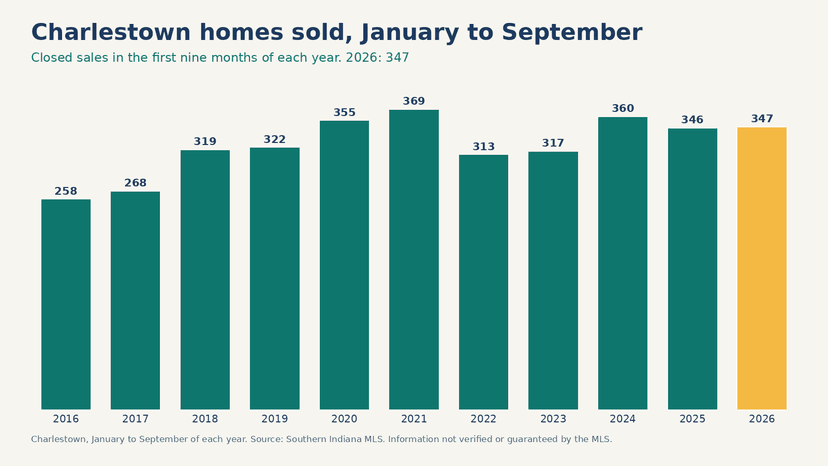
- Jan to Sep YTD sales: 347, about the same as 2025's 346.
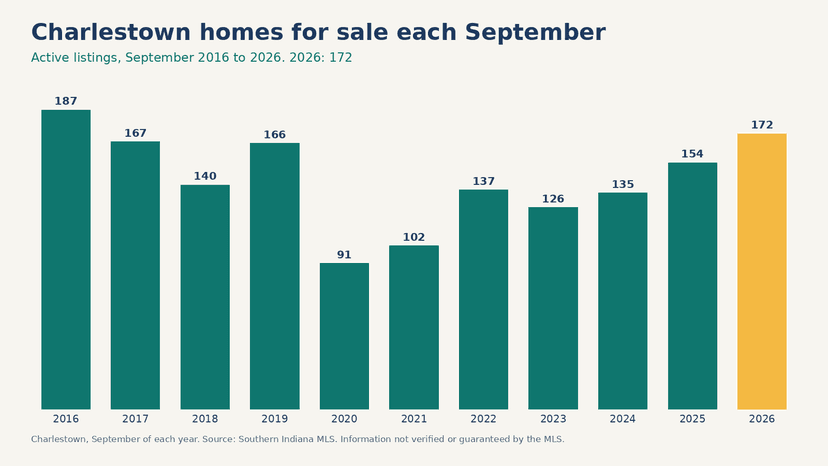
- Homes for sale, average month YTD: 151, up 23% vs 2025, the most since 2017.
- September: 172 homes for sale (154 a year earlier) and 36 sales (27 a year earlier).
- Average sale price, Jan to Sep YTD: $325,246, up 6.7% vs 2025. It's an average, not a median.
- Small numbers: monthly counts are small here, so we lean on year-to-date totals.
How many homes are for sale in Charlestown?
Short answer: 172 in September 2026, compared with 154 a year earlier. Across January to September, the average month had 151 homes for sale, up 23% from 123 in 2025. That's the highest average for those months since 2017.
Are homes selling in Charlestown?
Short answer: yes, at about the same pace as last year. 347 homes sold from January to September, compared with 346 in 2025. September alone had 36 sales, up from 27. With counts this small, one month can swing, so the nine-month total is the better guide.
The numbers: September and year to date
September only, compared with September 2025 (YoY):
| September only | Sep 2025 | Sep 2026 | Change (YoY) |
|---|---|---|---|
| Active listings | 154 | 172 | +18 homes |
| Homes sold | 27 | 36 | +9 sales |
| Average sale price (one month, small sample) | $315,952 | $337,811 | not meaningful |
January to September 2026 (YTD), compared with the same months of 2025:
| January to September (YTD) | 2025 | 2026 | Change vs 2025 |
|---|---|---|---|
| Active listings, average month | 123 | 151 | up 23% |
| Homes sold | 346 | 347 | up 0.3% |
| Average sale price | $304,861 | $325,246 | up 6.7% |
These are two different views. September is one month. YTD adds up January to September. Average sale price is an average, not a median, so a few high or low sales can pull it.
A note on small numbers: Charlestown has only a few dozen sales in a month, or fewer. One or two sales can move a monthly percentage a lot, so this post leans on counts and on January to September totals.
Is Charlestown a buyer's or seller's market?
Short answer: a little more room for buyers than a year ago. Using the average month so far this year, there were about 3.9 months of supply, compared with 3.2 for the same months of 2025. Months of supply is how long it would take to sell every home for sale at the current pace. Lower usually favors sellers, and higher gives buyers more room. This describes the past. It doesn't predict what comes next.
What this means for buyers
- More choice, steady demand. There are more homes to look at, but other buyers are still buying at last year's pace.
- Compare a few homes before you write an offer.
- Ask questions. Costs, repairs and timing are fair to raise. The seller can say no.
What this means for sellers
- Demand is steady, but you have more competition. Price against the homes buyers will tour alongside yours.
- Use recent closed sales to set a price, not last year's highest sale.
For Clark County as a whole, see the Clark County Q3 2026 market report.
Get introduced to a local agent
Agent Intro is an introduction and referral service of Aire Realty, LLC, an Indiana-licensed real estate brokerage, serving buyers and sellers in Southern Indiana and Greater Louisville. Fill out a short Match Profile. A member of our team will review your Match Profile, then introduce you to one of our vetted local real estate agents who fits your plans. You are never obligated to hire anyone. Questions? Email info@theagentintro.com.
Disclosure: The agent we introduce may be affiliated with Aire Realty, LLC, which operates Agent Intro. If so, we tell you when we make the introduction. Agent Intro earns a referral fee when an introduction leads to a closed transaction. When the introduction is to a partner brokerage, that brokerage pays the fee to Aire Realty, LLC. Full details are on our Disclosure page.
This post is general information, not financial, legal or tax advice. Market conditions change, and numbers for a single month can move a lot.
FAQs
How many homes sold in Charlestown, Indiana in 2026?
347 homes sold from January to September 2026, about the same as the 346 sold in the same months of 2025.
How many homes are for sale in Charlestown?
There were 172 active listings in September 2026, compared with 154 a year earlier. The average month this year had 151, up 23% from 2025.
What is the average home price in Charlestown?
The average sale price from January to September 2026 was $325,246, up 6.7% from the same months of 2025. It's an average, not a median.
Why use year-to-date numbers for Charlestown?
Charlestown has a few dozen sales a month or fewer, so a single month can swing a lot. January to September totals give a steadier picture.
Data note: Source: Southern Indiana MLS, Charlestown, monthly data January 2016 to September 2026. Information not verified or guaranteed by the MLS. Average sale price is a mean, not a median. Year-to-date (YTD) figures cover January to September. YTD average sale price weights each month by its number of sales. Months of supply uses active listings divided by sales.
Ready for a thoughtful introduction?
Tell us about your move. Get one carefully selected introduction. No obligation to hire.
Find my agent ↗