
Housing Crash in Southern Indiana? 3.9 Months of Supply Says Not So Fast
Southern Indiana had 3.9 months of supply in September 2026 and a median price up 5.1%. What months of supply means and why the data doesn't show a crash.
- market data
- Southern Indiana
- Kentuckiana
- FAQ

Key takeaways
- No crash in the local numbers. In September 2026, Southern Indiana's median sale price was $273,200, up 5.1% from a year earlier, according to local MLS data.
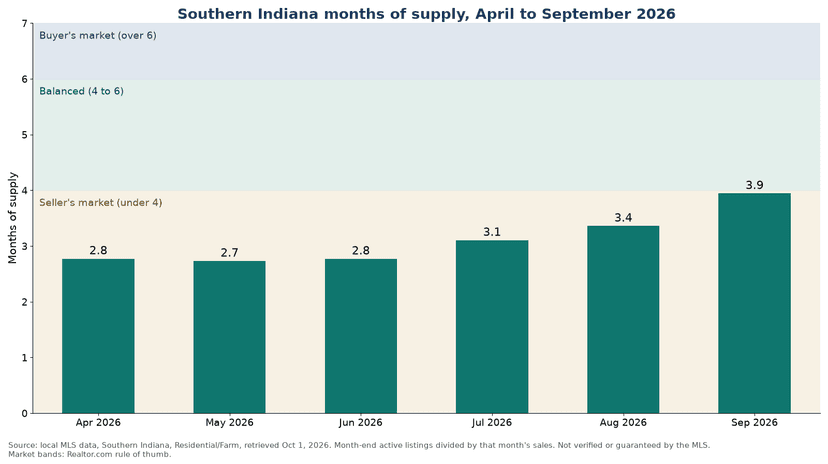
- Supply is rising, not exploding. Months of supply hit 3.9, up from 3.1 a year earlier and 2.8 in April.
- That is still just under "balanced." By the common rule of thumb, under 4 months favors sellers and 4 to 6 is balanced.
- Sales are flat, not falling off a cliff. 3,659 homes sold January to September, compared with 3,646 in 2025.
- Builders aren't flooding the market. Louisville-area single-family permits through August were less than half of the 2005 pace.
- Your street matters more than the average. County supply ranges from under 3 months to over 5.
Table of contents
- Is the housing market going to crash here?
- What does months of supply mean?
- Buyer's market or seller's market?
- Why are more homes for sale if prices aren't falling?
- What keeps a floor under prices?
- Why Kentuckiana isn't Austin
- What to do with this as a buyer or seller
- FAQs
TL;DR: The local data shows a Southern Indiana market that favored sellers through 2025 and most of 2026 and is now drifting toward balanced. More homes are for sale, and they take longer to sell. Prices are still higher than a year ago, and sales are holding steady. None of that looks like a crash.
Is the housing market going to crash in Southern Indiana and Louisville?
Short answer: nothing in the local numbers looks like one.
A crash needs a lot of owners who have to sell at the same time and can't find buyers. Here is what September 2026 local MLS data shows for Southern Indiana instead:
| Measure | September 2026 | A year earlier |
|---|---|---|
| Median sale price | $273,200 | $260,000 |
| Homes for sale at month end | 1,538 | 1,275 |
| Months of supply | 3.9 | 3.1 |
| Homes sold, January to September | 3,659 | 3,646 |
Prices are up, sales are steady, and supply is climbing. That's a market rebalancing. The slowdown is real, though. September sales were 390, down 6.0% from a year earlier, and homes averaged 91 days on market, up from 84. Sellers feel that. It just isn't what a crash looks like.
No one can promise where prices go next, and this post isn't a forecast. It is a read of what has already happened.
What does "months of supply" mean in real estate?
Short answer: how long it would take to sell every home on the market if no new listings came on.
The math is simple. Divide the homes for sale by the homes sold in a month. If 1,000 homes are for sale and 250 sell a month, that's 4 months of supply.
The common rule of thumb, as Realtor.com puts it:
| Months of supply | What it usually means |
|---|---|
| Under 4 | Seller's market. Fewer choices, faster sales, less room to negotiate. |
| 4 to 6 | Balanced. Both sides negotiate. |
| Over 6 | Buyer's market. More choice, more price cuts. |
Treat those lines as rough. Different data shops draw them in different places, and a 3.9 doesn't flip to a different market at 4.0. The direction matters as much as the number.
Months of supply is not the same as days on market. Days on market tells you how long a single home took to sell. Months of supply tells you how the whole market is balanced. Both are rising here.
Is Southern Indiana a buyer's market or a seller's market right now?
Short answer: still a seller's market on paper, but only just, and moving.
At 3.9 months in September 2026, Southern Indiana sits right under the 4-month line. The number has climbed every month since May, according to local MLS data:
| 2026 | Apr | May | Jun | Jul | Aug | Sep |
|---|---|---|---|---|---|---|
| Months of supply | 2.8 | 2.7 | 2.8 | 3.1 | 3.4 | 3.9 |
Buyers have more room than they've had in a while, mostly on homes that have been sitting. Sellers got 97.1% of their original asking price in September, down from 98.7% in June. That gap is where price cuts live. Our post on why houses don't sell digs into it.
One caution: the overall number hides a lot. Our Southern Indiana Q3 2026 county comparison uses a separate county-level MLS report with October snapshots. On that measure, months of supply ran from 2.8 in Scott County to 5.2 in Washington County. A 2.8-month county and a 5.2-month county are different markets. For detail, see the Clark County, Floyd County and Harrison County posts.
Why are more homes for sale in Clark and Floyd counties if prices aren't falling?
Short answer: more owners are listing, and buyers aren't keeping up.
Across Southern Indiana, 5,844 new listings came on from January to September, 7.9% more than the same months of 2025. Sales stayed flat. For every home that sold, about 1.60 new listings came on, up from 1.49 last year. The extra homes stack up as inventory.
Rates are part of it. Sales hit 507 in June and have fallen every month since, while mortgage rates climbed. Freddie Mac's weekly average for a 30-year fixed mortgage was 6.48% on June 4, 2026 and 7.32% on October 22, 2026, up from 6.19% a year earlier (Freddie Mac PMMS). Higher payments shrink budgets, and some buyers wait.
If you're wondering what the Fed meeting next week does to that rate, we covered that in what the Fed can and can't do to your mortgage rate.
Why won't Southern Indiana prices crash with rates above 7%?
Short answer: few forced sellers, little new building, and buyers still buying.
- Lots of owners have cheap mortgages. Freddie Mac's weekly 30-year average hit 2.65% in January 2021 (Freddie Mac PMMS). An owner with a rate like that usually sells because life requires it (a job, a divorce, an estate), not because of a headline, and rarely at a fire-sale price.
- Builders aren't overbuilding. Louisville-area single-family permits were 2,421 from January to August 2026, compared with 2,439 a year earlier. In the same months of 2005, before the last bust, it was 5,371 (U.S. Census Bureau via FRED). Today's pace is less than half of that.
- Homes priced right still sell. 3,659 Southern Indiana homes sold in the first nine months of 2026, about the same as 2025, according to local MLS data.
None of that means prices can't dip. The median eased from June's $286,000 high to $273,200 in September, which is a normal late-summer pattern here. It means the ingredients for a crash (lots of forced sellers, a building boom) aren't showing up.
Why is Kentuckiana different from Austin or Florida?
Short answer: our prices rose slower, so there's less air to let out.
Compare the two metros on the FHFA house price index:
| Metro | Early 2020 to mid-2022 | Mid-2022 to mid-2026 |
|---|---|---|
| Louisville area (includes Clark, Floyd, Harrison, Scott and Washington counties in Indiana) | up about 30% | up about 21% |
| Austin, Texas | up about 62% | down about 11% |
Sources: FHFA All-Transactions House Price Index, Q1 2020, Q2 2022 and Q2 2026, for the Louisville metro and Austin metro, via FRED.
Austin ran up fast and gave some of it back. The Louisville area rose at a steadier clip and kept rising, up 3.8% in the year to Q2 2026 on the same index. Even through the 2008 bust, the Louisville-area index fell about 6% from its early-2008 high to its 2011 low. That was painful for anyone who had to sell, but it wasn't the kind of drop some Sun Belt markets saw.
Past performance isn't a promise. It does explain why "the market is crashing" headlines written about Austin or Florida don't map neatly onto Jeffersonville or New Albany.
What should buyers and sellers do with this?
Short answer: stop waiting for a crash and look at your own price range.
If you're buying:
- Expect more choice and more room on homes that have been listed a while, especially after a price cut. Our post on how buyers negotiate at 7% rates covers where that room usually is.
- Don't plan around falling prices. The median is still up from a year ago.
- Run your own numbers with our affordability calculator before you shop. See our buying page and the Jeffersonville buyers guide.
If you're selling:
- Price for today's competition, not last spring's. More homes are for sale than a year ago.
- Expect a buyer to ask for something. Our post on whether sellers should offer closing cost assistance walks through the options.
- See our selling page and the New Albany sellers guide.
Want numbers for your neighborhood and price range? A Match Profile takes a few minutes.
Get a local read on your price range
Agent Intro is an introduction and referral service operated by Aire Realty, LLC, a licensed Indiana real estate brokerage, serving home buyers and sellers in Southern Indiana and Greater Louisville. Fill out a short Match Profile. A member of our team will review your Match Profile, then introduce you to one of our vetted local real estate agents who knows your area and price range. You are never obligated to hire anyone.
Already talking with an agent and want a comparison? Second Opinion is built for that. See How It Works, How We Choose Agents, and our FAQ.
Related reading:
- Southern Indiana Housing Market Q3 2026: 5 Counties Compared
- Why Didn't My House Sell? Expired Listings in Southern Indiana
- How Buyers Negotiate at 7% Mortgage Rates
- How Local Market Knowledge Affects a Home Sale
Disclosure: The agent we introduce may be affiliated with Aire Realty, LLC, which operates Agent Intro. If so, we tell you when we make the introduction. Agent Intro earns a referral fee when an introduction leads to a closed transaction. When the introduction is to a partner brokerage, that brokerage pays the fee to Aire Realty, LLC. Full details are on our Disclosure page. This post is general information, not financial, legal, tax, or lending advice.
FAQs
Is the housing market going to crash in Louisville or Southern Indiana?
The local data doesn't show it. In September 2026, Southern Indiana's median sale price was up 5.1% from a year earlier and sales were flat year to date, according to local MLS data. That points to a shift toward balance, not a crash.
Is Southern Indiana a buyer's or seller's market right now?
Still a seller's market by the usual rule of thumb, but barely. Southern Indiana had 3.9 months of supply in September 2026, just under the 4 months where a market is usually called balanced.
What is months of supply in real estate?
It is how long it would take to sell every home for sale at the current pace if no new listings came on. It equals homes for sale divided by homes sold per month.
Is months of supply the same as days on market?
No. Days on market measures how long each home takes to sell. Months of supply measures the balance of the whole market. Both are rising in Southern Indiana.
Will home prices drop in Clark and Floyd counties?
No one can promise. The Southern Indiana median eased from June's high, which is normal for late summer, and was still up 5.1% from a year earlier in September 2026. Clark and Floyd county medians were up in Q3 2026 too.
Does Louisville have the same months of supply?
Not necessarily. The local figures here come from MLS data for Southern Indiana. Louisville is tracked in a separate MLS, so ask a Louisville agent for Louisville data.
Data note: Source: SIRA Matrix (Cotality) Stats, Residential/Farm, January 1 to September 30, 2026, retrieved October 1, 2026. Information not verified or guaranteed by the MLS. Months of supply is month-end homes for sale divided by that month's sales. County figures come from the separate county reports linked above. Mortgage rates: Freddie Mac PMMS, weekly 30-year fixed average, October 22, 2026. Permits: U.S. Census Bureau via FRED, Louisville/Jefferson County KY-IN metro, 1-unit structures, not seasonally adjusted, January to August. Home prices by metro: FHFA All-Transactions House Price Index via FRED, through Q2 2026. Market bands: Realtor.com rule of thumb.
Ready for a thoughtful introduction?
Tell us about your move. Get one carefully selected introduction. No obligation to hire.
Find my agent ↗