
Best Time to Sell in Louisville: Season Guide
Seasonal guide to selling in Greater Louisville. Pick a listing date based on your deadline, home readiness, and local competition.
- Agent Selection
- Local Market
- Real Estate
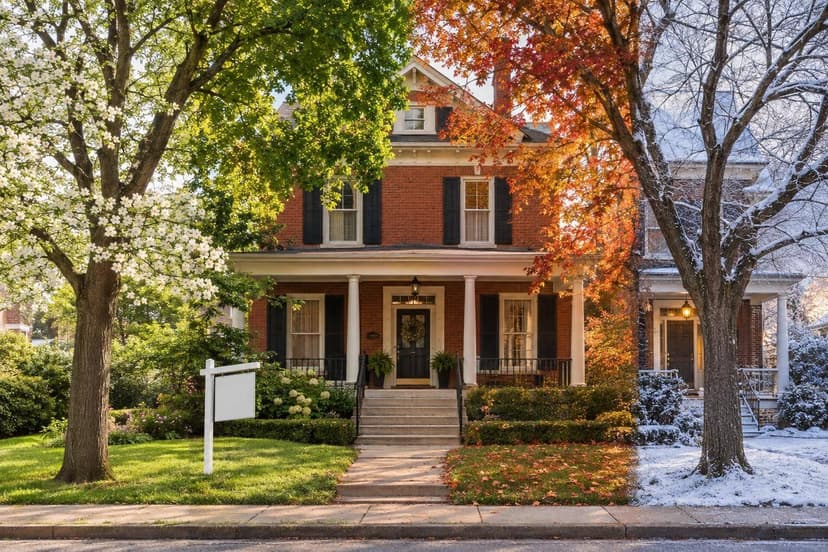
My advice: choose your listing date around your deadline, your home’s condition, and nearby competition - not the season alone. As of November 2, 2026, I’d weigh listing this winter against using the next few months to prepare for spring 2027.
Here’s how I’d narrow the choice:
- Spring: Aim for more buyer exposure, but prepare for more competing homes.
- Summer: Plan around school breaks, vacations, and your closing date.
- Fall: Consider lower listing competition, balanced against fewer buyers.
- Winter: Focus on a move that can’t wait, realistic pricing, and safe showing access.
Quick Comparison
| Season | Buyer activity | Listing competition | Main reason to consider it |
|---|---|---|---|
| Spring | High | High | Price and exposure |
| Summer | Moderate to high | Moderate to high | School-break moves |
| Fall | Lower | Often lower | Less competition |
| Winter | Lowest | Often lower | A firm moving deadline |
More activity doesn’t always mean a faster sale. Greater Louisville’s average market time rose from 37 days in July 2025 to 47 days in July 2026.
Before choosing a date, I’d compare recent sales, active listings, and pending sales in your part of Jefferson, Clark, or Floyd County. Then I’d <u>work backward from your move-out date</u>, leaving time for repairs, photos, showings, and closing.
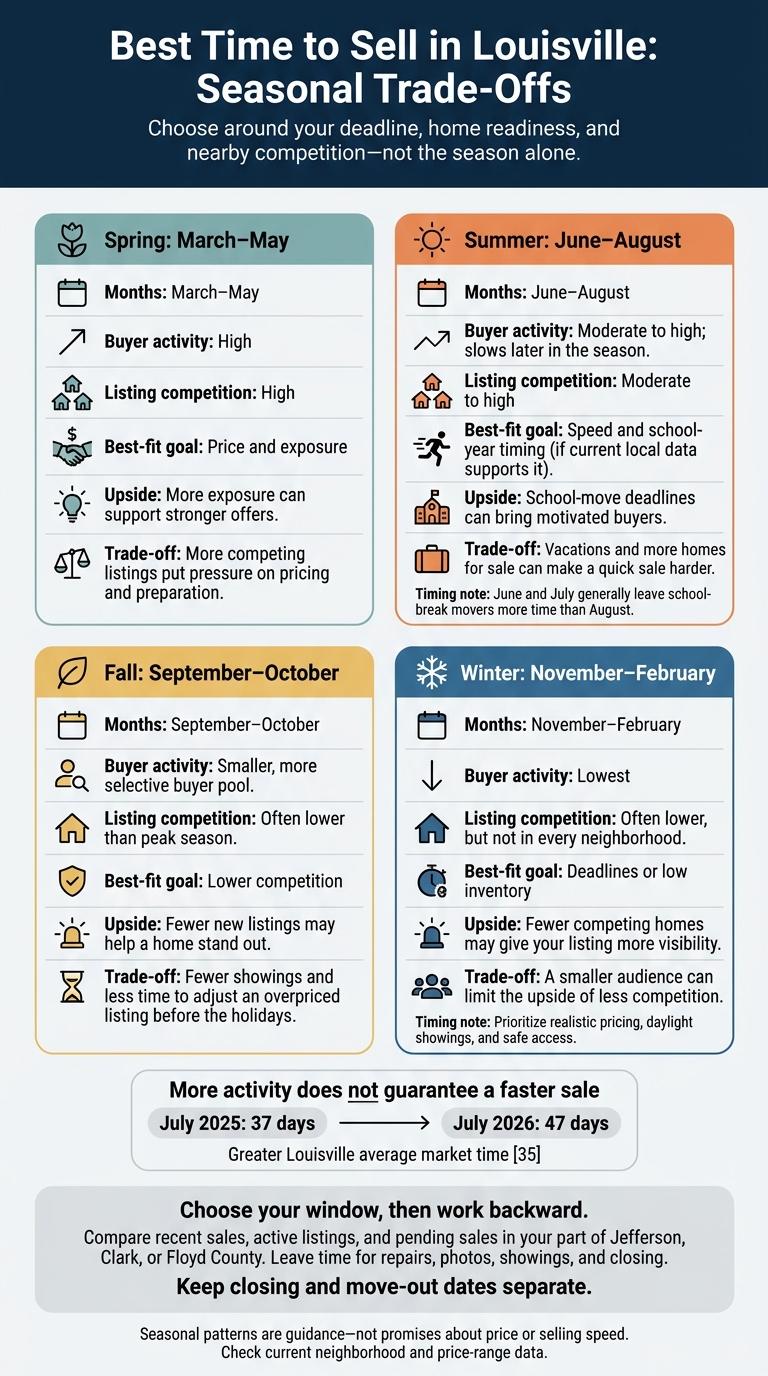
Best Time to Sell in Louisville: Seasonal Trade-Offs
How to Sell Your House Fast: Louisville Real Estate & Home Staging Tips
1. Spring: March Through May
Spring is the busiest window, but your best launch date depends on how fast you need to sell, your target price, and when you plan to move.
Louisville’s average highs climb from 58°F in March to 78°F in May, making yard cleanup, photos, and showings easier. Rain still needs a place in your plans: average monthly precipitation ranges from about 4.6 to 5.1 inches. Check gutters, drainage, and basement moisture before listing, and allow extra time for exterior photos.
Pricing
Spring demand can help support your price - but it won’t justify an inflated one. In March 2026, Greater Louisville’s median sale price reached $289,990, and homes sold for an average of 98.4% of list price. Base your asking price on recent comparable sales and the homes buyers can choose from today, not an assumed spring premium.
Speed
A local two-year analysis found average market times of 37.9 days in March versus 26.6 days in May. Those figures describe past sales, not what your home will do. March 2026 cumulative days on market reached 67 days. Watch showing activity and buyer feedback during your first two weeks.
Closing timeline
A May closing usually means listing in March or April. Start prep six to eight weeks before launch, and finish repairs, cleaning, and staging before photos.
School calendars affect move dates, too. Jefferson County Public Schools lists May 24 as the last student day for 2026–27. Southern Indiana districts may follow different calendars, so settle closing and possession dates before accepting an offer.
Competition
March gives you an earlier start. April pairs better curb appeal with school-year planning. May brings more activity, but also more competing homes.
In March 2026, Greater Louisville new listings rose 19.8% year over year, while inventory increased 41.9%. Competition in Jefferson, Clark, or Floyd County can matter more than seasonal trends. Before listing, compare nearby homes by price, condition, size, and commute access.
If spring prep runs late, summer shifts the trade-offs toward timing and competition.
2. Summer: June Through August
Sale price potential
Summer doesn’t guarantee a higher sale price. Median sold prices were $305,000 in June, $299,000 in July, and $292,000 in August. Treat these figures as context, not a forecast for your home.
Time to sell
Average days on market were 47 in June, 45 in July, and 43 in August. Vacations can disrupt tours and negotiations. Offer flexible showing times and arrange coverage for offers and inspections while you’re away.
Move timing
June and July generally leave school-break movers more time than August. Jefferson County Public Schools began its 2026–27 school year on August 6, 2026, leaving little time that month to move before school started. Check the relevant district’s calendar in Jefferson, Clark, or Floyd County before choosing dates.
For a late-May or June launch, start preparing in April or May. Set closing and possession dates separately.
Listing competition
Active inventory rose from 2,148 homes in June to 2,452 in July 2026. With more homes listed in July, base your asking price on direct competitors in your neighborhood and county.
Keep up curb appeal by mowing, weeding, and tending flowers. Arrange lawn care if you’re taking a vacation. July and August average highs reach about 88°F, so keep the home cool, offer morning or evening tours, and clear storm debris before showings.
3. Fall: September Through October
By September, summer’s urgency usually gives way to a smaller, more selective buyer pool. Fall may suit sellers who want less competition or a move before the holidays, rather than the highest price or fastest sale.
Sale price potential
Less competition doesn’t replace smart pricing. Base your asking price on recent neighborhood comps. A Louisville-area September 2026 report recorded a $280,000 median sold price and a 98.4% sale-to-list percentage. Review showing activity and offers 10 to 14 days after launch.
Time to sell
Buyer activity often picks up after Labor Day, once summer travel ends and school starts. Even so, September 2026 Louisville-area reports showed roughly 27 to 49 days on market, depending on the county and reporting method.
Have utility information, floor plans, and repair records ready so relocating buyers can assess the property. Your closing window matters just as much as your listing date.
Move timing
A September listing leaves more time before holiday deadlines than a late-October launch. Allow several weeks for preparation and closing, especially if you want to avoid moving in November or December.
Listing in October can push closing into those months. Check holiday travel plans and dates when you won’t be available before setting deadlines.
Listing competition
Fewer new listings may help your home get seen, but a smaller buyer pool can cancel out that edge. Check active and pending homes in your county and price range.
As temperatures drop and daylight fades, schedule exterior photos earlier in the day. Light steps and paths, clear fallen leaves, and offer weekend or early-evening tours. These details matter more as winter gets closer.
4. Winter: November Through February
Sale price potential
Winter works best for sellers who put move timing ahead of peak buyer traffic. November through January is usually quiet. February can bring early spring buyers, especially toward the end of the month.
A Jefferson County single-family analysis covering September 2024–August 2026 reported sale-to-list ratios of 98.70% in November, 97.95% in January, and 97.85% in February. These historical averages are not a forecast or a valuation of your home.
Time to sell
Winter often means softer prices and slower sales, so check local days-on-market data. The same analysis found average days on market of 27 in November, 36.6 in January, and 40.3 in February. Use current data for your neighborhood and price range. Don’t apply Jefferson County averages to homes in Clark or Floyd County. If you are selling to move across the river, find a local agent with dual-state licensing.
Move timing
Service the furnace or heat pump, replace filters, fix drafts, and keep the home heated. Build extra time into your schedule for inspections, appraisals, moving, storms, and holidays.
Listing competition
With fewer buyers visiting, make it easy to schedule a showing. Lower traffic puts more weight on price, presentation, and access. Aim for daylight appointments: Louisville gets roughly 9 hours and 30 minutes of daylight near the December solstice.
Before showings, clear snow and ice from parking areas, walks, and steps. Use surface-safe ice melt, and keep the garage, basement, and utility areas accessible. Reschedule when travel is unsafe.
Seasonal Advantages and Drawbacks
The season-by-season breakdown shows how timing can affect a sale. Here’s how those trade-offs line up with seller goals.
Buyer activity and competing listings aren’t the same thing. Local market commentary puts Louisville’s busiest listing period between late March and early July. Activity slows from August through October and reaches its lowest point from November through February. Treat these patterns as timing guidance - not promises about price or selling speed.
The best time to list depends on both market conditions and how ready you are to sell.
| Season | Typical buyer activity | Competition | Upside | Downside | Best-fit goal |
|---|---|---|---|---|---|
| Spring: March–May | High. | High | More exposure can support stronger offers. | More competing listings put pressure on pricing and preparation. | Price and exposure |
| Summer: June–August | Moderate to high; slows later in the season. | Moderate to high | School-move deadlines can bring motivated buyers. | Vacations and more homes for sale can make a quick sale harder. | Speed and school-year timing |
| Fall: September–October | Smaller, more selective buyer pool. | Often lower than peak season. | Fewer new listings may help a home stand out. | Fewer showings and less time to adjust an overpriced listing before the holidays. | Lower competition |
| Winter: November–February | Lowest. | Often lower, but not in every neighborhood. | Fewer competing homes may give your listing more visibility. | A smaller audience can limit the upside of less competition. | Deadlines or low inventory |
Summer activity doesn’t guarantee a faster sale. Greater Louisville had approximately 4,480 homes for sale in July 2026, up 34.5% from July 2025. Average market time increased from 37 to 47 days.
Before choosing a quieter window, ask a local Realtor to compare active listings, pending sales, and recent price reductions for your county, property type, and price range. Low inventory helps only when buyers want a home like yours. Weigh any upside from waiting against carrying costs and your deadline.
Next, compare those trade-offs county by county.
Compare Jefferson, Clark, and Floyd County Markets
Compare counties to find a listing window that fits your goal: speed, price, or move timing. County snapshots offer a starting point - not proof that one season wins. Use them as baselines until you can compare monthly data across all three counties. Louisville-wide statistics can’t fill gaps in county-level data.
| County | Seasonal pattern | Current local markers | Recommended data checks |
|---|---|---|---|
| Jefferson County, KY | Compare spring and early summer with fall rather than assuming spring wins. Useful for sellers weighing speed against spring competition. | March 2026: 3,136 active listings, 40 median days on market, $274,500 median listing price, and 99% sale-to-list ratio. | Compare monthly closings, new listings, pending sales, inventory, days on market (DOM), and sale-to-list ratio by ZIP code, price band, and property type. |
| Clark County, IN | Treat stronger spring demand as a theory until monthly data support it. Useful for testing spring timing against school-year moves. | January 2026: 617 active listings, $290,000 median listing price, 46 median days on market, and 100% sale-to-list ratio. September 2026: 289 new listings and 3.3 months of inventory. | Compare the same monthly metrics for March–May and September–October. |
| Floyd County, IN | Test whether spring performs better than fall. Useful for sellers weighing listing visibility against fall competition. | March 2026: 400 active listings, $289,900 median listing price, 50 median days on market, and 98% sale-to-list ratio. | Compare spring and fall using the same monthly metrics, plus price reductions. |
For a useful comparison, reports need matching definitions and time frames. More spring closings paired with shorter market times support a launch focused on speed. Fewer fall listings help only if pending sales hold up.
County averages can also hide neighborhood differences. Compare Louisville homes by commute access, age, condition, and price. In Southern Indiana submarkets, group listings by commute access, age, condition, and buyer pool before comparing monthly metrics.
To weigh stronger spring demand against lighter fall competition, pair two or three years of monthly county reports with 90–180 days of comparable closed sales, along with active listings and pending sales. Use that mix to assess which window fits your price target, selling timeline, or move date.
Choose Your Listing Window and Work Backward
Use the seasonal and county comparisons above to choose the earliest listing window that fits your move-out date. This matrix turns market conditions in Jefferson, Clark, and Floyd County into a listing plan.
| Seller goal | Listing window to consider | Checks before committing |
|---|---|---|
| Maximize price | Spring, once prep is complete | Comparable sales, competing listings, buyer demand, repair return on investment, showing availability |
| Sell quickly | Late spring or early summer, if current local data supports it | Comparable-home days on market, inventory, pricing accuracy, showing flexibility, response time |
| Coordinate a school-year move | Early enough to meet your closing and move dates | School calendar, contract-to-close estimate, replacement-home timing, temporary housing, possession terms, contingencies |
| Reduce competition | Fall or winter | Weather, buyer pool, holiday schedules, carrying costs, presentation in low light |
| Meet an urgent deadline | The earliest date the home is fully ready to list | Repairs, disclosures, title issues, deadlines, pricing, financing risk, backup housing |
Work backward from your launch date. Book a consultation and pricing review several weeks ahead. Spend the next two to four weeks on priority repairs, decluttering, and staging. Finish cleaning, landscaping, and photography one to two weeks before listing, then confirm the price, disclosures, and showing instructions a few days before launch.
Once your home is listed, allow time for showings, negotiation, contract work, inspection, appraisal, underwriting, title, the final walkthrough, and closing. One market source suggests roughly 30–40 days from contract to funding, but treat that as a planning estimate - not a deadline. Financing, repairs, contingencies, and possession terms can shift the schedule. Put the closing date and move-out date in writing as separate dates.
If you’d like help choosing a Realtor, Agent Intro can match you with one carefully selected Realtor serving Greater Louisville and Southern Indiana, based on local experience, availability, and working style. Already have an agent in mind? It also offers a second-opinion introduction.
FAQs
Is waiting until spring worth the extra carrying costs?
Usually, yes - if you expect spring demand to help your home sell faster and spend less time on the market. But spring doesn’t guarantee a sale. Timing varies by neighborhood and county.
The first 48 hours matter. After 30 to 45 days without an offer, many homes need a pricing or marketing reset, which can mean higher carrying costs. Focus on local competition, months of supply, and when you’ll be ready - not just the season.
How can I tell if my neighborhood favors sellers?
Focus on neighborhood data, not citywide averages. For homes like yours, check inventory (months of supply), average days on market, and sale-to-list price ratios. Less supply, shorter selling times, and sale prices closer to asking prices usually give sellers more pricing power.
Compare recent sales with nearby active listings. School boundaries and flood-zone differences can tip the balance within just a few streets.
What if my home doesn’t sell before school starts?
Stay calm and review your home’s market position with your agent. No offers? Your price may not match buyers’ expectations, or your marketing may need an update. Look at recent comparable sales, days on market, and feedback from showings to decide what to change.
Need help finding an agent? Agent Intro connects sellers with experienced Realtors who know Greater Louisville and Southern Indiana.
Ready for a thoughtful introduction?
Tell us about your move. Get one carefully selected introduction. No obligation to hire.
Find my agent ↗