
New Albany, IN Housing Market: Prices and Inventory
Compare median prices, active listings and months-of-supply in New Albany, IN to see buyer vs. seller leverage.
- Agent Selection
- Local Market
- Real Estate
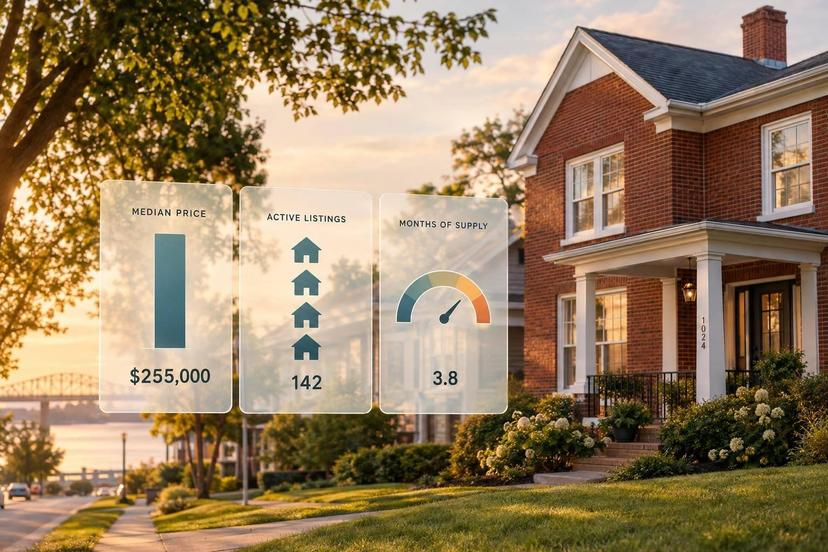
New Albany home sale medians range from about $235,000 to $260,000 across four sources - but they measure different areas and periods. As of November 13, 2026, reported supply ranges from 3.8 to 4.2 months. Buyers and sellers should choose a Southern Indiana agent to compare similar homes before using these figures to set an offer or asking price.
Quick Comparison
| Source | Median sale price | Active listings | New listings | Months of supply |
|---|---|---|---|---|
| Redfin | $235,000; three months ending September 2026 | Not reported | Not reported | Not reported |
| Resideline | $260,000; prior six months, ZIP code 47150 | 69 | Not reported | Not reported |
| Homes.com | $252,250; November 10 snapshot | 225 | No dated count | 3.80 |
| Agent Pronto | $235,000; July–September 2026 | 335 | Not reported | 4.2 |
These figures are not directly comparable. Dates, boundaries, and sales periods differ.
The main takeaway: more supply and slower sales may give buyers more room to negotiate, even when median prices rise. Sellers should check competing listings and recent nearby sales - not rely on a citywide median alone.
1. Redfin
Recent sale prices
Redfin’s New Albany, Indiana, snapshot, updated November 6, 2026, reports a median sale price of $235,000, up 5.1% year over year, for the rolling three months ending September 2026. The median is the midpoint: half of homes sold above that price, and half sold below it.
The median sale price per square foot was $145, down 10.5% year over year. These two measures can move in different directions when the mix of homes sold changes.
Buyers can use $235,000 as a broad starting point and $145 per square foot to compare similar homes. Sellers shouldn't assume their home's price rose 5.1%. Recent comparable sales and a pricing analysis specific to the property still matter.
Redfin provides usable price data here, but the snapshot lacks the inventory measures needed to assess supply.
Active listings
Active listings aren't reported in the November 6, 2026, snapshot, so this measure can't be compared here.
New listings
New listings aren't reported in the November 6, 2026, Redfin snapshot, preventing a comparison for this reporting window.
Months of supply
Months of supply isn't reported in the November 6, 2026, Redfin snapshot, so this source can't support a supply comparison here.
2. Resideline
Recent sale prices
Resideline’s November 9, 2026, snapshot covers ZIP code 47150 - not the entire city. Treat it as a local market sample. It reports 340 tracked closed sales over the prior six months, with a $260,000 median sold price. These are tracked sales, not an official total.
The middle 50% of tracked sale prices fell between $200,000 and about $336,765. Buyers can use this range as a starting point, then compare homes by property type, size, condition, and location.
Active listings
The snapshot also includes current inventory. On November 9, 2026, Resideline reported 69 active listings, 1 pending sale, and a $250,000 median asking price. That’s $10,000 below the median sold price, but it doesn’t establish a price trend: the two figures cover different homes and time windows.
New listings
New listings were not reported in this snapshot, so it doesn’t separate newly listed homes from total active inventory.
Months of supply
Months of supply were not reported. The 340 closings over six months and 69 active listings do not establish an official months-of-supply figure.
3. Homes.com
Homes.com provides a third dated snapshot, though its price and inventory periods don’t line up exactly with the other sources.
Recent sale prices
Homes.com’s recently sold page, updated November 10, 2026, reports a $252,250 median sale price, up 5% year over year. Its city guide reports about $250,000 for the prior 12 months, up 4%. These are separate snapshots, not interchangeable figures.
Active listings
The November 10 snapshot lists 225 homes for sale. The report doesn’t specify the exact boundary or property mix, so this count applies only to that source. Another Homes.com page shows 243 active listings in a different report; keep that figure separate from the 225 count.
New listings
Homes.com did not report a dated count of new listings.
Months of supply
Homes.com reports 3.80 months of supply on its November 10 page. At that sales pace, current inventory would last about 3.8 months if no new homes were listed.
4. Agent Pronto
Agent Pronto’s November 8, 2026, market report covers inventory and sales pace for July 1–September 30, 2026, in New Albany, Indiana. It uses a rolling-quarter view, so compare it only with data defined the same way.
Recent sale prices
The median sale price was $235,000, up 5.1% from the prior quarter. That gain doesn’t mean prices will keep climbing.
Active listings
Agent Pronto reports 335 active listings, compared with 273 in October–December 2025 and 249 in January–March 2026. Comparisons should use similarly defined rolling periods.
New listings
New listings were not reported. The 335 active listings represent total reported inventory - not homes newly listed during the quarter.
Months of supply
Agent Pronto reports 4.2 months of supply, up from 1.8 months in September 2025. This measure puts the active-listing count in context: more supply usually means more choices and more room for buyers to negotiate.
Sales also moved more slowly. Homes sold and pending sales were both down more than 20% year over year, while median days on market rose from 17 to 62. Higher inventory and slower sales point to a more balanced market than a year earlier, but they don’t necessarily mean prices are falling.
Comparing Active and New Listings
Active listings are homes currently for sale. New listings are homes entering the market during a set period. Pending listings are already under contract and should not count as available inventory.
Each measure tells a different story, especially because prices and supply don’t move in a straight-line relationship.
Active Listings vs. Pending Listings
The counts below aren’t directly comparable. The sources use different geographic boundaries and observation dates.
| Source | Geography | Date | Active listings | Pending listings |
|---|---|---|---|---|
| Resideline | ZIP code 47150 | November 9, 2026 | 69 | 1 |
| Homes.com | New Albany, IN | Updated November 10, 2026; observation date unconfirmed | 225 | Not reported |
Don’t average these counts. Differences in boundaries and coverage can explain the gap. Buyers should confirm a home’s current status before touring. Sellers should base pricing on homes that compete directly with theirs - not the broadest inventory total.
Active inventory shows what buyers can choose now. New listings show how fast those choices are changing.
New Listings by Reporting Period
The supplied data don’t include a verified current new-listing total for New Albany. Redfin’s earlier result showed 39 new listings, but its September 21, 2026, page update didn’t establish the counting window. That means the figure cannot serve as a November weekly or monthly total.
Changes in active inventory can’t fill that gap. Contracts, withdrawals, expirations, and relistings also affect the count.
New listings give buyers more choices and sellers more competition. Buyers should weigh condition, location, financing, and comparable sales. Sellers should prepare pricing, repairs, and photography before putting their home on the market.
Comparing Months of Supply
New Albany Housing Supply: What the Numbers Mean
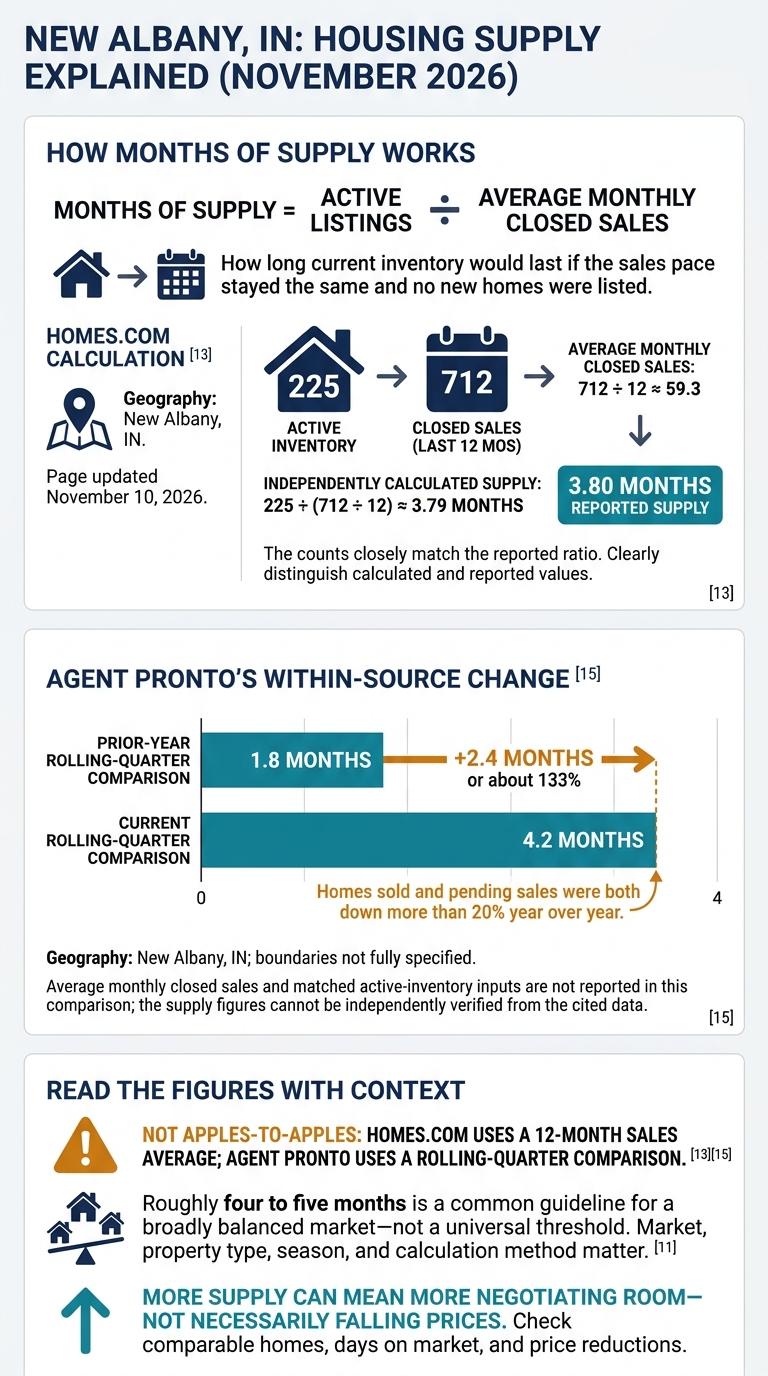
Months of supply equals active listings divided by average monthly closed sales. It estimates how long current inventory would last if the sales pace stayed the same and no new homes were listed. This turns a listing count into a measure of how fast buyers are purchasing available homes.
| Source | Observation date | Geography | Active inventory | Sales period and average monthly closed sales | Reported or independently calculated supply | Interpretation |
|---|---|---|---|---|---|---|
| Homes.com | November 10, 2026 (updated) | New Albany, IN | 225 | Last 12 months: 712 closed sales, or about 59.3 per month | 3.80 months reported; independently calculated: 225 ÷ (712 ÷ 12) ≈ 3.79 months | The counts closely match the reported ratio. |
| Agent Pronto - current | Current rolling-quarter comparison | New Albany, IN; boundaries not fully specified | Not reported | Rolling three-month comparison; average monthly closed sales not reported | 4.2 months reported; cannot be independently verified from the cited data | - |
| Agent Pronto - prior year | Prior-year rolling-quarter comparison | New Albany, IN; boundaries not fully specified | Not reported | Rolling three-month comparison; average monthly closed sales not reported | 1.8 months reported; cannot be independently verified from the cited data | Lower supply than the current reading. |
Homes.com uses a 12-month sales average; Agent Pronto uses a rolling quarter. The figures offer a general comparison, but they aren't apples-to-apples. Those differences matter when using supply to assess negotiating power.
Within Agent Pronto’s comparison, supply rose by 2.4 months, or about 133%, assuming the geography and method stayed the same. The source also reports year-over-year declines of more than 20% in both homes sold and pending sales. That helps explain the shift: supply can rise because sales slow, inventory grows, or both.
A common guideline treats roughly four to five months as broadly balanced. But that range varies by market, property type, season, and calculation method. New Albany buyers can compare these readings with days on market and price reductions before negotiating. Sellers should check competing homes and recent comparable closings in their price range, using supply alongside days on market and price cuts to assess their leverage.
Using Market Data to Buy or Sell
Compare like-for-like data: the same date, geography, property type, and definition. Then use the price and supply readings above to judge how much room you have to negotiate.
| Metric | Buyer use | Seller use | Limitation | Negotiation cue |
|---|---|---|---|---|
| Recent sale prices | Build an offer range using recent comparable sales. | Set a list-price range backed by sales data. | A median is a benchmark, not an appraisal. | If matched comps are below asking, request a lower price or concessions. |
| Active listings | Compare direct alternatives. | Review competing homes and how they’re presented. | Counts show supply, not demand. | If similar homes sit unsold or cut prices, negotiate repairs or credits. |
| New listings | Track newly listed choices. | Plan your launch price, marketing, and showing schedule. | Seasonality and relistings can distort short reporting windows. | If comparable new listings outpace pending sales, sellers may face more competition. |
| Months of supply | Gauge your potential negotiating room. | Plan pricing and expected time on market. | It measures market pace, not one listing’s timeline. | If supply increases while marketing times lengthen, consider concessions or a price adjustment. |
Narrow your comparisons by neighborhood, price range, condition, housing type, and days on market.
A renovated detached home and a dated condo are not comparable.
For buyers, price is only part of the offer. Weigh financing certainty, inspection protections, and closing flexibility, too. Sellers should set a review point for showing activity, feedback, and offers before deciding whether to change the home’s presentation or price.
With the numbers matched to the right home, you can choose a pricing or offer strategy.
Ask a Realtor with recent New Albany or Southern Indiana experience who also knows your property type and price range. Agent Intro connects buyers and sellers with one carefully selected Realtor based on local experience, availability, and working style. If you already have an agent in mind, it also offers a second-opinion introduction.
FAQs
How can I tell if a New Albany home is overpriced?
Compare the home with similar homes that sold in the past 60 to 90 days, rather than online estimates or neighbors’ asking prices. If it’s been on the market longer than average or had price cuts, the asking price may not match buyer demand.
If you’re selling, use the first two weeks as a market test. Steady showings without offers likely mean your price is too high.
What seller concessions should I ask for?
Seller concessions are common in Southern Indiana. In Q3 2026, roughly half or more of sales in local counties included credits. Ask your lender for a written, side-by-side comparison of a price reduction, seller-paid closing costs, and a seller-paid interest rate buydown.
Look beyond the price tag to your monthly payment. Choose the mix that helps lower your upfront costs and monthly payments, based on your loan terms and long-term financial goals.
How often should I review my home's asking price?
Treat your home’s first two weeks on the market as a test period. If buyers tour the home but don’t make offers, your asking price may not match current demand.
Before listing, agree with your agent on a price-change plan. That way, you can act quickly if those two weeks pass without an offer. If your home isn’t selling, compare your price with recent closed sales, not active listings that haven’t sold.
Ready for a thoughtful introduction?
Tell us about your move. Get one carefully selected introduction. No obligation to hire.
Find my agent ↗